All official European Union website addresses are in the europa.eu domain.
See all EU institutions and bodies
An official website of the European Union | How do you know?
Environmental information systems
Marine litter is defined as any persistent, manufactured or processed solid material discarded, disposed of, or abandoned in the environment. It is now widely recognised that the amount of litter in the environment is significant and increasing. For this reason, marine litter is the focus of growing political attention around the world.
In relation to 'Marine litter’, the Marine Strategy Framework Directive considers that 'good environmental status' is achieved when ‘Properties and quantities of marine litter do not cause harm to the coastal and marine environment.
Which are the related MSFD Descriptors?
Properties and quantities of marine litter do not cause harm to the coastal and marine environment
Litter emissions and pollution
Litter emissions come from diverse land-based or sea-based sources, such as urban areas, tourism, fisheries, shipping, aquaculture, agriculture and other activities. Litter can enter environment directly (e.g. lost fishing gear, cigarette butts) or by sewage systems and run-off outlets from urban areas. Large quantities of litter are transported from land to the sea by rivers (Figure 1).
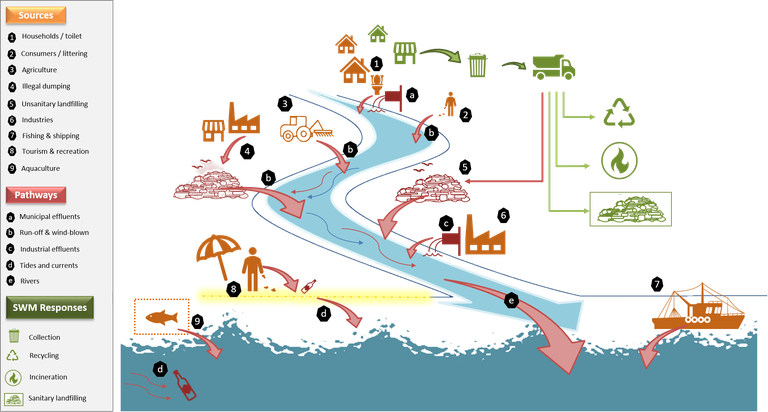
Figure 1: Key sources (orange) and pathways (red) of marine litter, as well as solid waste management (SWM) responses (green). Credits: Joana Mira Veiga, Deltares.
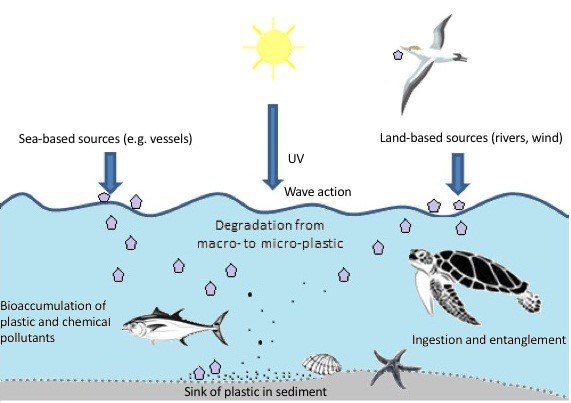
Figure 2: Degradation pathways of plastic in the sea with ingestion pressure presented (ETC ICM, 2019)
General outcomes from the regional assessments
Outcomes from the MSFD assessments
In 2018, Member States had to update the Good Environmental Status (GES) assessments performed under Marine Strategy Framework Directive Article 8. The present dashboard displays the overall status reported by countries for the features, where the results show which is the percentage of assessments where GES has been achieved, not achieved or is unknown or not assessed.
References
- EC, 2008. Directive 2008/56/EC of the European Parliament and of the Council of 17 June 2008 establishing a framework for community action in the field of marine environmental policy (Marine Strategy Framework Directive) (Text with EEA relevance)↵
- ↵EC, 2017. Commission Directive (EU) 2017/845 of 17 May 2017 amending Directive 2008/56/EC of the European Parliament and of the Council as regards the indicative lists of elements to be taken into account for the preparation of marine strategies (Text with EEA relevance), https://eur-lex.europa.eu/eli/dir/2017/845/oj
- a bUNEP MAP, 2017. Mediterranean Quality Status Report, https://www.unep.org/unepmap/resources/quality-status-report-mediterranean-med-qsr-2017
- ↵ETC/ICM Report 4/2019: Multiple pressures and their combined effects in Europe's seas, https://www.eionet.europa.eu/etcs/etc-icm/products/etc-icm-report-4-2019-multiple-pressures-and-their-combined-effects-in-europes-seas
- ↵OSPAR Commission, MSFD Advice document on Good environmental status - Descriptor 7: Hydrographical conditions, A living document - Version 17 January 2012. ISBN 978-1-909159-16-7 Publication Number: 583/2012, https://www.ospar.org/documents?v=7289
- HELCOM, 2018. State of the Baltic Sea – Underwater sound↵
- ↵BSC, 2019. State of the Environment of the Black Sea (2009-2014/5), http://www.blacksea-commission.org/Inf.%20and%20Resources/Publications/SOE2014/