All official European Union website addresses are in the europa.eu domain.
See all EU institutions and bodies
An official website of the European Union | How do you know?
Environmental information systems
On average, Europe has plenty of water to meet its needs, but large differences in climate makes water much less abundant in southern than in northern Europe. Our changing climate is likely to make the differences more extreme.
In Europe, annual renewable freshwater resources are relatively abundant, amounting to a long term average 4,560 m3 per person. However, climatic variations cause considerable differences across Europe, ranging from 120 m3 per person per year in Malta, to 70,000 m3 per person per year in Norway. As climate is changing, renewable freshwater resources are also expected to change, becoming scarcer in already dry areas
Did you know?
The average household consumption of water in Europe is 53 m3 per person per year
The agricultural sector is the largest water consumer in Europe
Over exploitation of water still occurs in parts of Europe
Status
EEA has assessed Europe’s water resources between 1990 and 2017, by source, by season, by economic sectors and by geographic area.
In Europe, most water is abstracted from surface waters. Around 75% of total water abstraction is from rivers and reservoirs, and 25% from groundwater. Abstraction rates are highest during the growing season (Figure 1 ).
Water is used for agriculture (58%), energy cooling (18%), mining (11%) and households (10%). Thus, agriculture is the economic sector using the largest share of renewable water resources (Figure 2).
Figure 1
Freshwater abstraction in Europe by source, 2017
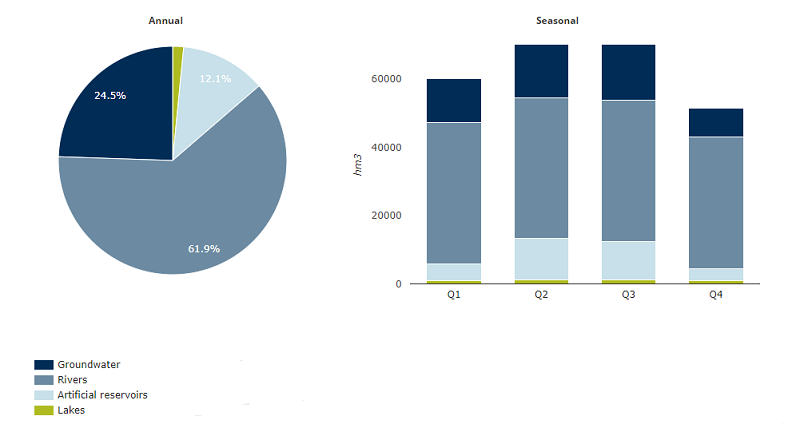
Source: Use of freshwater resources in Europe. EEA Indicator Assessment, 2019
Figure 2
Water use in Europe by economic sector, 2017
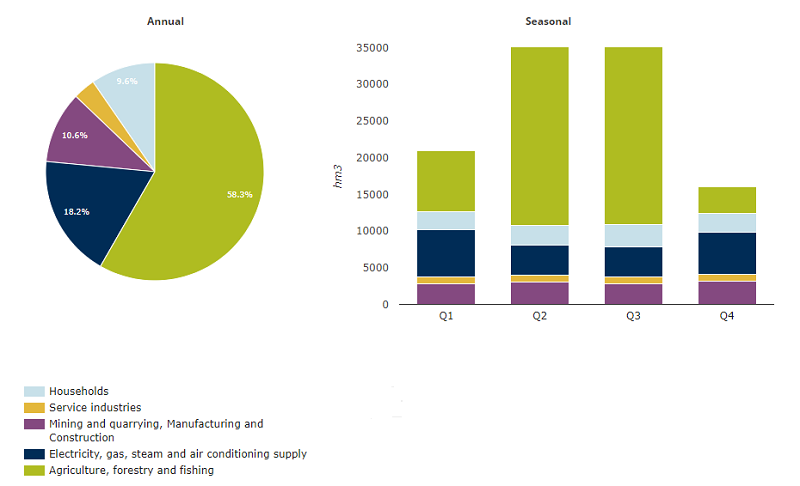
Source: Use of freshwater resources in Europe. EEA Indicator Assessment, 2019
Note:
The pie chart shows the annual data for the year 2017 for water abstraction by source at the European level. The quarterly values have been used to show the development of seasonal water abstraction by source. Q1: January, February and March. Q2: April, May and June. Q3: July, August and September. Q4: October, November and December.
Water scarcity occurs where insufficient water resources are available to satisfy annual requirements. It refers to a situation of unbalanced use of water, where water demand for human activities systematically exceeds the water supplied by the natural system.
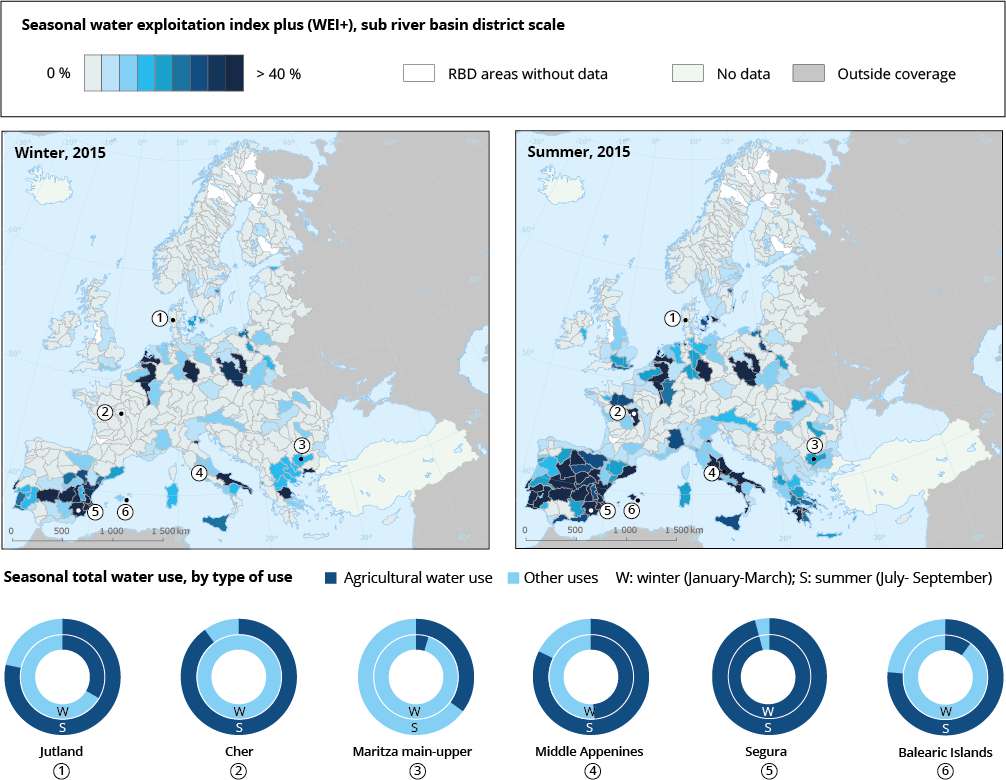
Water scarcity is most frequent in southern Europe. This is particularly so during summer, because of higher abstractions from agriculture, public water supply and tourism. Because of very intensive irrigation, the Middle Apennines and the Po Basin (Italy), Guadiana (Portugal and Spain) and Segura (Spain), experience severe water scarcity throughout the year. Mediterranean islands, such as the Balearic islands, Crete and Sicily experience incessant and severe water stress conditions throughout the year, with agriculture and tourism exerting very high pressures. This is pattern is shown for 2015 in Figure 3.
Water scarcity is, however, not limited to southern Europe. In other parts of Europe, urbanisation, combined with high abstractions from the energy and industrial sectors for cooling purposes and from the public water supply sector can also create water scarcity. Higher pressures than the regional average can be observed in the wider area of Copenhagen, London and Stockholm, and the river basins of the Loire, Meuse, Oder and Weser rivers. In addition, droughts also occur where water scarcity might not be perceived as a critical issue (e.g. in Scandinavia during the summer of 2018, the Elbe basin in the summer of 2015 and the Black Sea basin in 2007). This pattern is also shown for 2015 in Figure 3.
Figure 3
Seasonal water scarcity in European sub-basins expressed through water exploitation index (WEI+)
Results for the winter and summer of 2015. Difference between winter and summer is primarily due to agricultural water use.
Note:
Assessments of the sustainability of water abstraction at the European level remain limited by data availability and the approach to interpretation of water returns. This may lead to large differences in the European WEI compared to national datasets. An example of this occurs in the south-western subbasin of France along the Atlantic Coast, an important maize production area. There, the national estimate of WEI is around 50% because it adopts no water returns from agriculture, whereas the European estimate, which is based on 31 % returns ratio from agriculture, is below 10%.
Trends
Water abstraction has increased in southern Europe since 1990; by 30% for electricity cooling, and by 9% for agriculture. At the country level, trends in sectoral pressures vary considerably. For instance, water abstraction for agriculture has increased significantly in Turkey (70%) and Greece (11%), whereas water abstraction for electricity cooling has increased significantly in the Netherlands (23%) and Slovenia (18%) (Figure 4).
On average, EU Member States have made considerable progress towards reducing total water abstraction. The main improvements encompass improvements in water conveyance, efficiency gains in water use and socio-economic transformations, particularly in eastern Europe. Overall, total water abstraction has decreased by 17% between 2000 and 2017.
The goal of reducing water abstraction to below 20% of renewable freshwater resources, as set in the Roadmap to a Resource Efficient Europe, has, however, not been achieved in all European river basins and does not look realistic in the short term.
Figure 4
The development of water abstraction in Europe since the 1990s

Source: Use of freshwater resources in Europe. EEA Indicator Assessment, 2019
Related Resources
Country profiles
Data and maps
Indicators
Publications
Other related resources
References
The main reference used in this page is:
Use of freshwater resources in Europe. EEA Indicator Assessment, 2019